Customer Support Dashboard
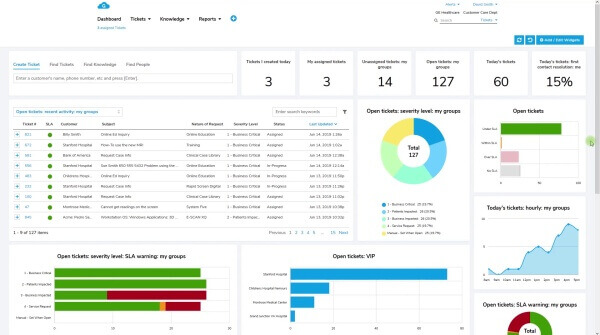
Learn how Giva's configurable customer dashboards enable support managers to understand precisely what's happening, & more crucially, how customers are being affected.
What's in this article?
- Customer dashboard insights for senior leaders
- Customer service dashboards can help decrease call volume
- Customer dashboards based on how you work
- Use customer dashboards to rapidly understand analytics
- Customer dashboards help concentrate on data-driven decision making to minimize call volume
- Customized real-time analytics using a customer service dashboard
- Visualize real-time analytics and data with a customer dashboard
- Easy-to-draw parallels and trends with customer dashboards
- Create customer dashboards
Customer dashboard insights for senior leaders
Senior leaders are largely accountable for communicating the value their firms provide to customers. Monitoring customer performance indicators in real-time with customer dashboards is very beneficial to this objective.
Customer service dashboards can help decrease call volume
Giva's customer dashboards allow supervisors and managers to understand precisely what's occurring, and more crucially, how consumers are being affected. They enable leaders and workers to take swift action to resolve little issues before they become significant. Support teams' short-term effectiveness may also be measured with customer dashboards.
Customer dashboards based on how you work
Imagine being able to see your department's workload in an easily configurable customer dashboard with widgets that are suited to your needs.
This facilitates rapid comprehension of who is working on what. Before entering a critical meeting, a senior leader can obtain some fast understanding with only a glance at a customer service dashboard:
- Customer contentment
- First call resolution
- Total ticket volume
- Compliance with Service Level Agreements
- Top ticket categories
- Age of open tickets
- Save time, enhance efficiency
Use customer dashboards to rapidly understand analytics
It is essential to recognize which issues require quick action and remediation. This data must be simple to read and interpret, as well as actionable. If the same concerns are continually brought up by customers, then there may be areas of the organization that need to change. Often, senior executives have limited time to comb through data to extract insights. They aim to gain a rapid understanding of their consumers' most pressing problems, concerns, and hotspots through the usage of insights that are visual and color-coded.
Customer dashboards help concentrate on data-driven decision making to minimize call volume
With Giva's customer service dashboards, your team will be able to stay focused on their priorities, while supervisors and leaders will be able to see a comprehensive picture of all customer concerns to make more informed decisions. Being able to quickly identify the most crucial customer concerns will ensure that they are handled first.
Customized real-time analytics using a customer service dashboard
Requests for new and updated spreadsheets, pivot tables, and reports are overwhelming and require a lot of time from support groups. A customer ticket dashboard utilizes real-time data, and does not require manpower, resulting in considerable time and resource savings. The data may be utilized immediately to solve problems. Reporting analytics are a crucial component of the monitoring and evaluating processes. However, reports are historical, and thus they only provide information about the past and not the present.
Visualize real-time analytics and data with a customer dashboard
Customer dashboards may be used to show essential indicators and KPIs for measuring the productivity and effectiveness of a team in real-time. Metrics allow senior management to evaluate the overall health of a firm. To give everyone the insights necessary to make data-driven decisions, customer dashboards must be simple to access and interpret.
Easy-to-draw parallels and trends with customer dashboards
It is essential that your customer service dashboards provide context for the data displayed. Customer dashboards enable senior leaders to make rapid analysis of real-time and past data to spot trends and patterns. Often, when data is displayed in real-time, hidden patterns and correlations are revealed.
Create customer dashboards
Giva customer dashboards can be easily and quickly configured with little effort or training. We offer a library of widgets that are already preconfigured, and this library is always growing with new ways to gain real-time insights. With the default layout, no administration or configuration is necessary.
You can reposition and resize the widgets on your customer dashboard, and everyone may customize their own dashboard to their liking. While constructing yours, you may view examples of each widget type. Once created, anybody can get more information by mousing over the colorful charts and graphs. This color-coded information can help prioritize actions, and you can click on any chart to get more information with all the details. Data table columns can be rearranged, and widget visuals and data can be exported to image or spreadsheet, or for printing.


